Combining Data Sources and Insights for Actionable Results
Let’s say you have an e-commerce business highly dependent on the data you capture in Google Analytics. The environment is changing, so you begin to collect data on the customer level (first-party data) to identify key parameters to your products and offerings. You make decisions based on this data and maximize what you have collected — but what comes next? It’s time to add on another layer, or even two. Also known as data blending.
One of the most brilliant things modern data tools allow us to do is to layer and combine different data sets to provide a holistic view of your products, customers, and business activity. By doing so, we can begin to make smarter decisions and take action like most others can’t.
Why is this important?
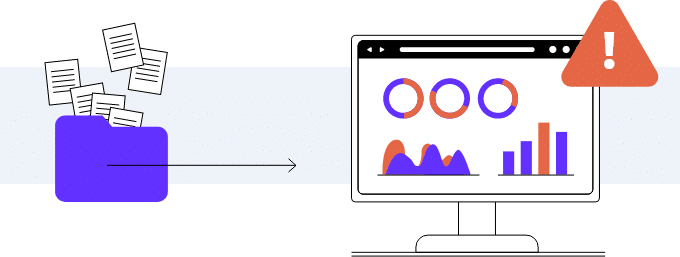
The saturation of data for online businesses has become hard to manage, even though data capture and collection is relatively new for most businesses out there. Furthermore, most technologies business owners collect data from (ie. Shopify, Ad Networks, Google Analytics, and more) are singular and rarely have easy ways to meld the data for an “overview” of what’s going on.
This is a technology problem, but where there is a technology problem, there is a technology solution. BI tools (business intelligence) tools like Tableau, Domo, and others allow you to import or query different data sets, combine them, and create impactful dashboards. All you need is a data pipeline – or sources to utilize in this data import.
So why is this important? Siloed data only paints one picture, wherein combined data sources (when parsed properly) provide a masterpiece view of how your business is functioning, and what your customers really think.

Types of Data to Collect
To make your datasets and visualizations more valuable, it’s important to have the correct blend of types of data. Each source should serve as a true north, and blending similar data types can often skew your results. Here are three key data types to capture and blend together for a basic combination and viewpoint:
- User activity data like pages they visit, what they click on, where they leave the site, and how long they spend there
- Order data like products purchased, order value, and number of lifetime purchases
- Industry benchmarks and competitor data
The above key types of data allow you to create visualizations and insights that combine how user acts within the confines of your brand, what they’re most interested in, and a baseline for how performance should look.
Data Blending
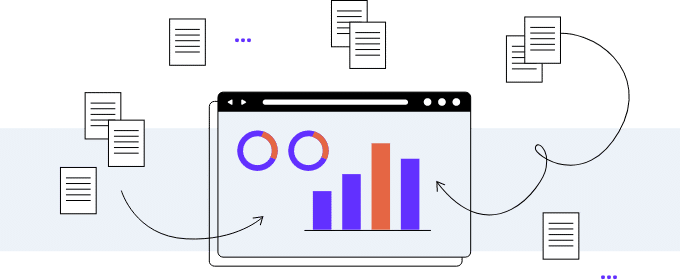
We at Power Digital (in conjunction with our nova and DataQ platforms) utilize Tableau to help proof and make data blended visualizations for use in our marketing efforts. On a technical level, data blending is the ability to combine multiple data sources into one view by finding either common fields in various data sets or correlations between fields.
One basic example of this to show you how we do this at Power Digital would be how we blend details around our clients to make faster internal decisions. Here is our first table:

This shows the very basics behind the clients included. Now we introduce our second table:

We now have bit more on their technical usage and marketing team, so if we blend these two tables, we have a better view and new fields we can generate:

You can see in our last table that we generated our own info based on a calculation of CMS marketing team accounts to total company size. This allows us to then make inferences about if they can manage their CMS, website, etc.
This is the most rudimentary example of data blending – but shows how new data can be generated by layering data sets on top of each other. Many BI tools like Tableau will help with this aggregation automatically and can even recognize correlations between fields within data sets.
In Conclusion
Combining your various data sets into one visualization tool allows you to paint a holistic picture of your customers, their interests and more. As data tracking becomes more and more unpredictable, one constant is the data you can directly collect now. By first collecting then finding creative ways to blend them together, you can generate your own insights.

